An enormous amount of planning and effort goes into staging a successful community event, and the Wisconsin Main Street staff is available to help evaluate an event’s effectiveness and point the way toward improvements.
These special events are often part of a community’s signature, and are important tools to help an area thrive and gain broad exposure. The Wisconsin Main Street staff, using data provided by Main Street communities after an event, can tailor custom impact reports to gauge an event’s success.
Several Main Street communities across the state use the data-driven reports to size up their events and target improvements. Examples include the Downtown Fond du Lac Fondue Fest, the Wine Walk in Racine and the Beloit Farmers’ Market.
While events are held for a variety of reasons, the ability to measure and demonstrate their value is an important step in evaluating and improving event offerings. That evaluation can provide an effective tool for fundraising and developing appropriate marketing strategies based on the profile of those attending.
Downtown Fond du Lac Partnership Director Amy Hansen uses the reports in many ways. They provide statistical information in the organization’s annual report and its yearly report to the City Council, and give information to businesses on why they should participate in special events.
Hansen says the reports also provide demographic and event impact information to attract sponsors, justify staff time and resources in undertaking special events, and demonstrate the economic impact and jobs created from these events.
Shauna El-Amin, executive director of the Downtown Beloit Association, also finds value in the reports.
“It’s great to know what impact you have on your community and be able to back that up with data,” El-Amin says.
To measure an event’s economic impact, it must have at least 200 attendees, of which at least 10% are traveling from more than 10 miles away. Collecting some or all this data for smaller events, however, will be useful for measuring changes over time and developing marketing strategies.
Much of this data can be collected easily during and immediately after an event, if organizers have a plan in place. Collecting information may require one or two additional volunteers, but the information gained from the process can help improve subsequent events, and result in increased revenue.
Event impact reports highlight several categories of data, including general information, a visitor profile, a business profile and spending at an event. Communities collect data for their events through surveys and counter and ticket information.
Here is a sampling of some of the staff’s impact reports. For more information about the reports, contact Adriana at adriana.saia@wedc.org.
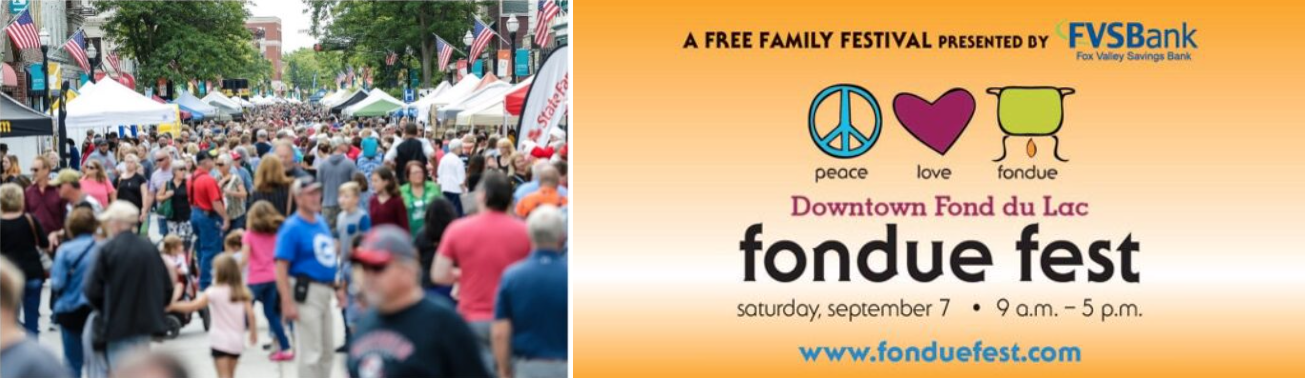
2019 Downtown Fond du Lac Fondue Fest
 |
 |
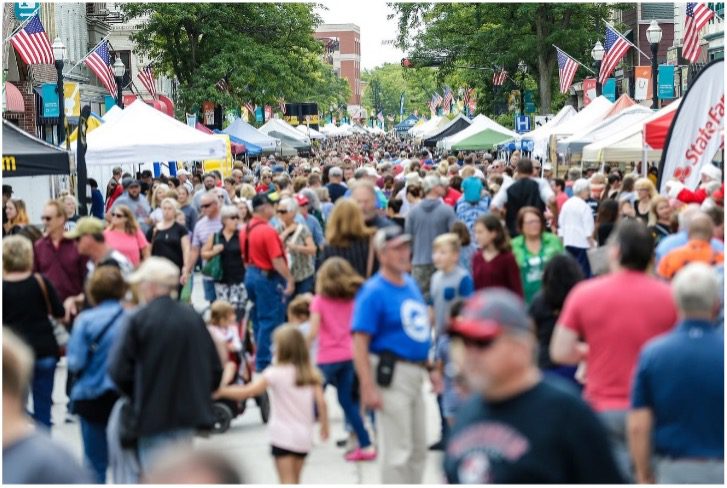
In 2019, the annual Downtown Fond du Lac Fondue Fest attracted 25,000 visitors (based on police estimates) and the weather was a perfect 70 degrees and sunny. The annual downtown fall festival began in 2000, when downtown merchants wanted to celebrate the reopening of Main Street following a lengthy construction project. Shops put sales on the street, and other vendors were invited. Since then, the festival has grown exponentially in every aspect: participation, attractions and attendance.
In 2007, the festival was given a new name – Downtown Fond du Lac Fondue Fest – and it attracted more than 15,000 attendees. The centerpiece for the festival became the world’s largest fondue set, which was created by an engineering and fabrication team from Brenner Tank.
The “world’s largest” name was conferred by the Guinness Book of World Records and presented to the Downtown Fond du Lac Partnership. This re-styled event attracted visitors and vendors from throughout the Midwest and was covered by media outlets from throughout Wisconsin and the Chicago Sun-Times. The festival was even covered nationally by CNN. Blogs and other internet media sources provided additional buzz. The event was a great success and raised more than $3,000 for the Fond du Lac Area Agri-business Council.
In 2019, Moraine Park Technical College Culinary Arts Program was back with cheese and chocolate fondue on the corner of Division and Main, and the Noon Optimist Club served queso and pizza fondue on the corner of First and Main. In addition to live music, the festival also offered the second annual fondue-eating competitions on the Young Professionals of FDL North Stage.
The Kids Zone was open from 9 a.m.-2 p.m. for bouncing and climbing or petting and play-dough making. The day served as a fundraiser for numerous nonprofits and included the Big Race! Family-Friendly Scavenger Hunt benefiting Fond du Lac area kids and the third annual “Cheese And Quackers 500” rubber duckie raffle and duck chuck, raising $4,650 for Salute the Troops, which was a 32% increase over last year.
Visitor profile
Police estimate that 25,000 individuals attended the event. Only 48 participants were surveyed. Using information from the survey and data from similar events statewide, the following visitor profile was developed:
Fully 70% of visitors are from Fond du Lac and the immediate surrounding area. An additional 17% traveled from the broader region (10-60 miles distant), while 4% traveled from elsewhere in the state and the remaining 9% from another state. Most attendees had never participated in the event, with about 62% new attendees.
Returning visitors spent slightly more at the event, $40 versus $37 average. Returning visitors also spent more at downtown businesses while in town for the event, $56 versus $22 average.
Business profile
In total, 221 vendors participated in the event. These included a mix of prepared food, produce, artisan and resale goods, and businesses and nonprofits.
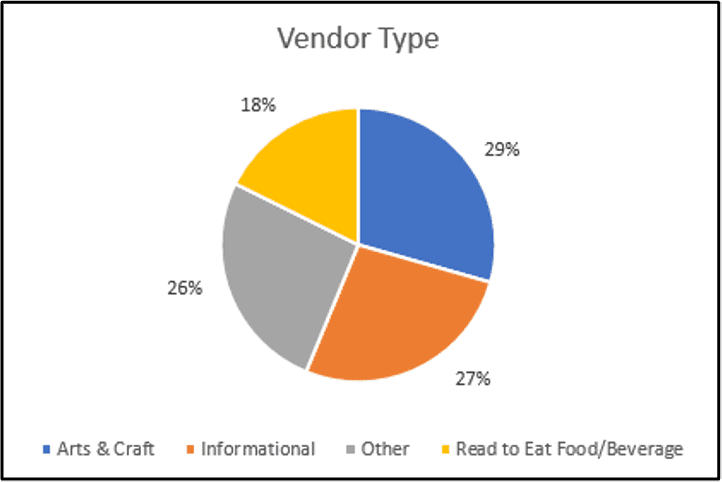
Unsurprisingly, given the nature of the event, prepared food vendors reported the highest earnings, with an average gross sale of $3,139 per vendor, although actual sales ranged from $1,100 to $9,100. Other artisan and produce vendors earned significantly less, averaging $513 with a range of $45 to $2,000 over the course of the event. A total of 28% of vendors were businesses and nonprofits that were not offering direct sales of goods at the event, and subsequently, sales by these businesses are not included in impact estimates.
Based on a survey of 71 participating vendors, the event was successful, with 97% of vendors indicating that they were able to interact with attendees, and 92% reporting that attendees represented their target demographic. Fully 85% report an intention to return in future years. Only seven vendors indicated that they felt the fees were too high, and a few others felt that the congestion made it difficult for set-up and take-down.
Spending
When combining the reported customer spending information and vendor sales data, total estimated spending as part of the event (sales at the event, funds raised by the Big Race! Family-Friendly Scavenger Hunt, spending at downtown businesses during the event and resulting from travel to the event) was estimated to be $1.5 million. Considering the additional wages earned by vendors, value of volunteer labor and additional spending multipliers, the regional impact is estimated at $1.7 million.
2020 Downtown Racine Wine Walk
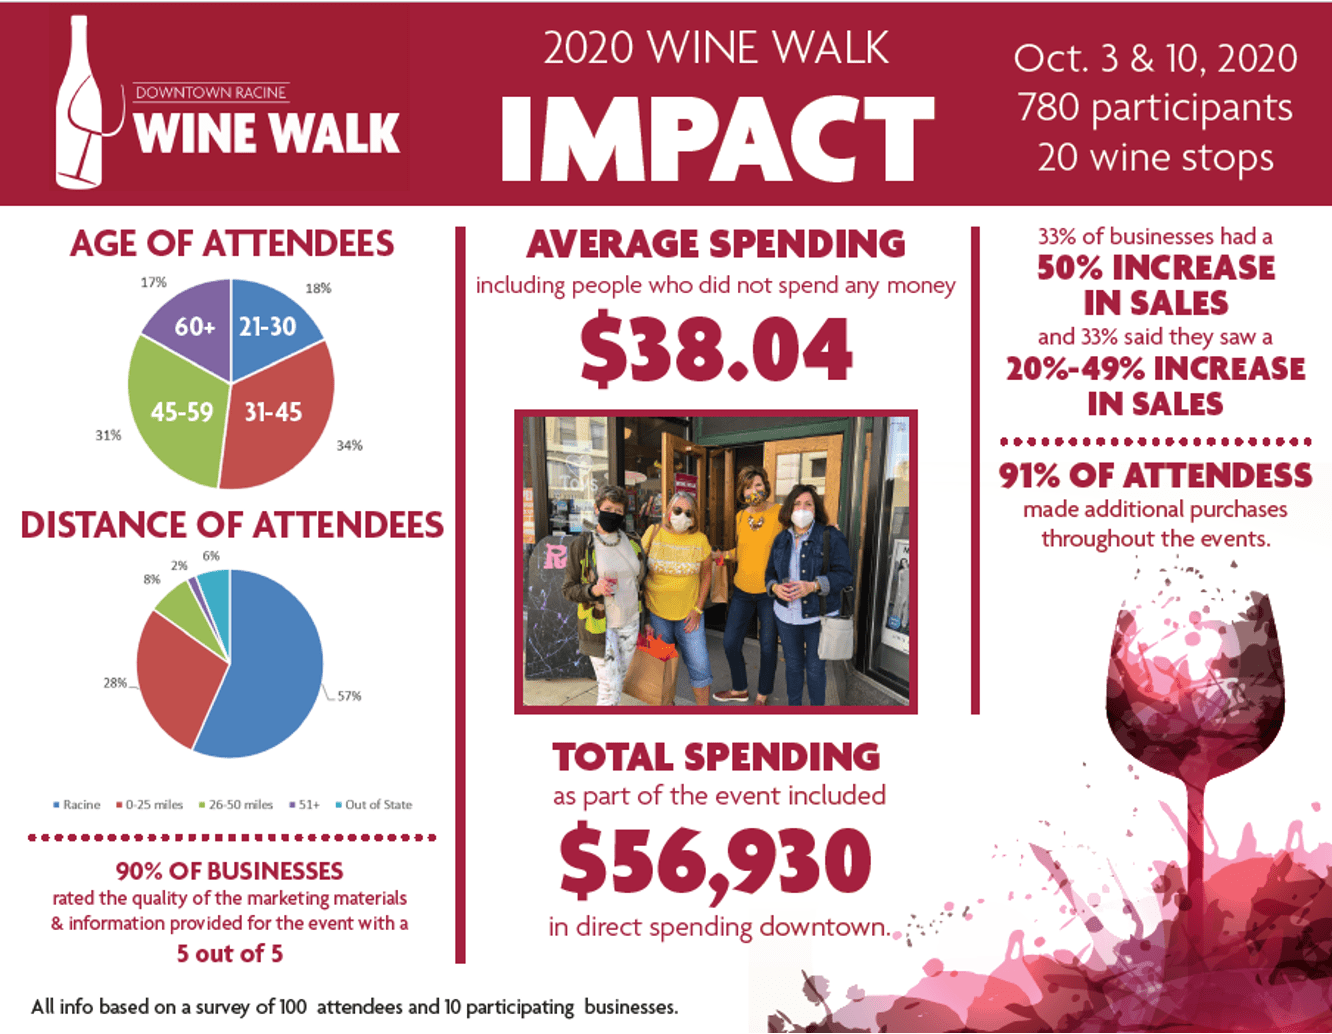
Downtown Racine hosted its annual Downtown Racine Wine Walk on Oct. 3 and 10, 2020. Due to the pandemic, adjustments were made from previous years, with four time slots that attendees could sign up for, including: Oct. 3 from 1-4 p.m., Oct. 3 from 4-7 p.m., Oct. 10 from 1-4 p.m. and Oct. 10 from 4-7 p.m.. A total of 780 individuals purchased admission to the event for $40, and there were about 200 attendees at each session. Each ticketholder received 20 wine samples (one from each location), a reusable plastic wine sampling glass, a bottle of wine (with four wine options to choose from) and a wine tote-bag including various coupons from downtown merchants. Participating businesses provided a total of 23 stops, with 20 wine stops, two hydration stops with grab-and-go snacks, and one raffle basket stop during the walk.
Visitor profile
In total, 780 individuals attended the Downtown Racine Wine Walk. The event attracted visitors from mostly a small geographic area. 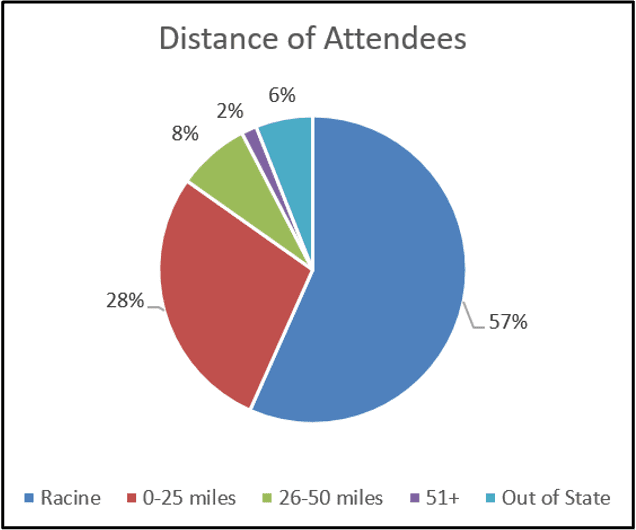
As shown on the chart, the majority of attendees were from Racine, while an additional 28% came from surrounding regions, including Kenosha, Mount Pleasant and Pleasant Prairie. A total of 8% of attendees came from 26 to 50 miles away, including Milwaukee, Germantown and Lake Geneva, and 6% were from out of state, with the remaining 2% coming from more than 51 miles away. Based on purchase data, 40% of attendees chose Moscato for their take-home bottle of wine, 22% chose Cabernet, 22% chose Pinot Noir, and the remaining 16% chose Moscato. Three-quarters of tickets were sold to individuals and 25% to couples or groups and 84% of attendees were female.
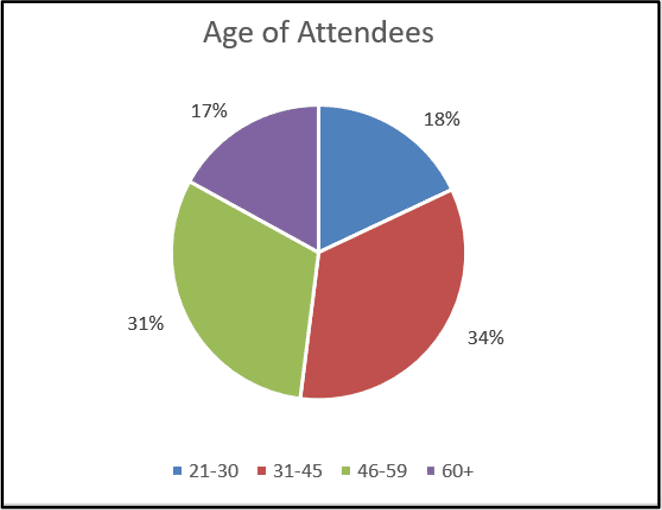
Based on a survey of 100 attendees, the largest group of attendees were between the ages of 31 and 45, with 31% of attendees between the ages of 46 and 59, and 18% of attendees between the ages of 21 and 30; the remaining 17% of attendees were 60 or older.
According to the survey, attendees reported a positive experience at the event, with 85% of attendees rating the event very good to excellent. In addition, the majority of attendees said the value of the price for the event was above average to excellent, and 43% gave a five-star rating to the materials received at the event. Meanwhile, 31% of attendees rated the value of the price of the event below average to average, and 21% rated the quality of material received below four stars. The majority of attendees said they had not previously attended a Wine Walk in Racine, and 81% said they visited a bar or restaurant downtown Racine either before the event.
Business profile
In total, 23 businesses participated in the event, with 20 businesses hosting wine, two businesses hosting a water stop with grab-and-go snacks and one business hosting a raffle basket stop. As a follow-up to the event, 10 businesses provided data and feedback on their experience during the evening.
Businesses overall were pleased with the impact of the event, with all respondents saying they would participate in this event again in the future.
Fully 89% of businesses said they were open additional hours or hired additional staff for the event, and 90% of businesses rated the quality of the marketing materials and information provided for the event with a five out of five. In addition, 33% of businesses said they had more than a 50% increase in sales during the event, an additional 33% said they saw a 20% to 49% increase in sales, while another 22% said they saw a 10% to 19% increase in sales, and the remaining 11% said they saw a 20% to 29% increase in sales. In addition, 38% of businesses said they had 300 to 499 attendees visit their business over the two Saturdays, while an additional 38% of businesses said they had 100 to 299 attendees visit their business, and the remaining 25% said they had more than 500 attendees visit their business.
Based on a survey of 100 attendees, 91% of participants made additional purchases throughout the events.
As shown in the chart, most of the attendees said they spent more than $50 during the event, with 30% of attendees spending $25 to $49 and 22% of attendees spending under $25, while the remaining 9% of attendees said they did not spend any additional money at the event. The average amount spent at the event was between $36.25 (including people who did not spend any money) and $39.84 (excluding people who did not spend any money).
Impact
Total spending as part of the event amounted to $56,930 in direct spending downtown.
2019 Beloit Farmers Market
“We love to use our yearly reports of events as selling points for our community members, vendors and sponsors.
It’s great to know what impact you have on your community and be able to back that up with data.
When we started surveying and collecting this data years ago (2013), we were at about 3,000 people on average per week visiting out market. Look at us now!”
– Shauna El-Amin | Downtown Beloit Association – Executive Director
The Beloit Farmers Market has been occurring on Saturday mornings in downtown for more than 50 years. The market is coordinated by the Downtown Beloit Association and spans two blocks of on-street space and an adjacent parking lot at the intersection of State Street and Grand Avenue in downtown Beloit. The market runs from the beginning of May through the end of October on Saturday mornings from 8 a.m. until 1 p.m. This study examines vendor and visitor patterns occurring over the six-month 2019 market season.
Visitor and vendor profiles
Economic impact and the market’s success depend on the makeup of vendors and visitors who attend the market. This section explores the characteristics of vendors and visitors present at the Beloit market.
Vendor profile
In 2019, Beloit’s Saturday market included goods and produce from 104 vendors. Just under half of these vendors attended at least three-quarters of all market dates, with an average of 74 vendors present on each market day, with a low at the end of the season at an average of 47 vendors in the last three weeks.
 Vendor Location of Origin
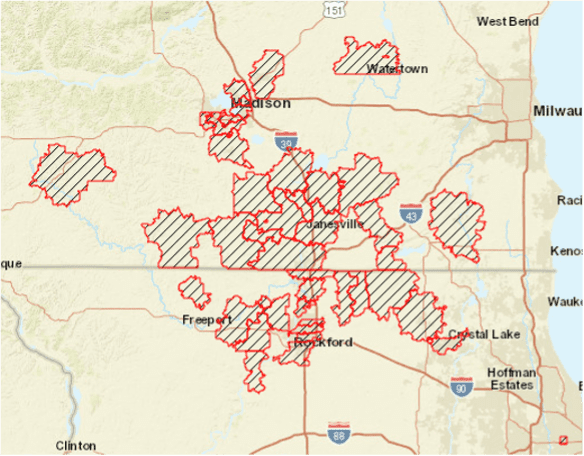
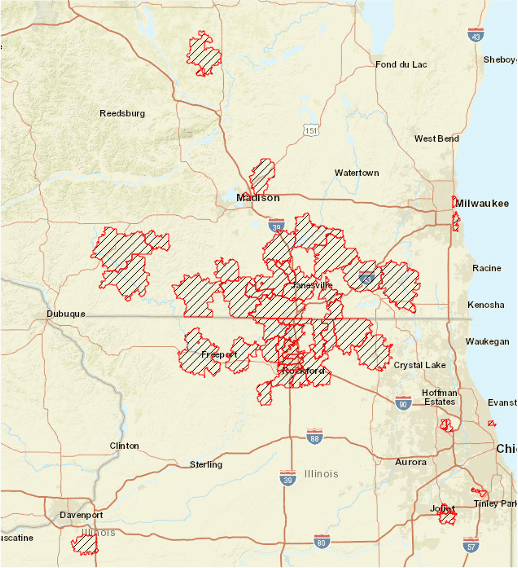
Vendors at the Beloit market come from a broad geographic area, as shown on the map at right. In total, 29% of vendors are based in the City or Town of Beloit, an additional 35% travel from a home base within the Beloit metro area (Rock County in Wisconsin and Winnebago County in Illinois), and the remaining 36% travel from further-flung areas to participate, including the Chicago area and out-state Wisconsin.
Of course, the number of vendors offering various types of goods for sale influences the amount of customer spending in each category.
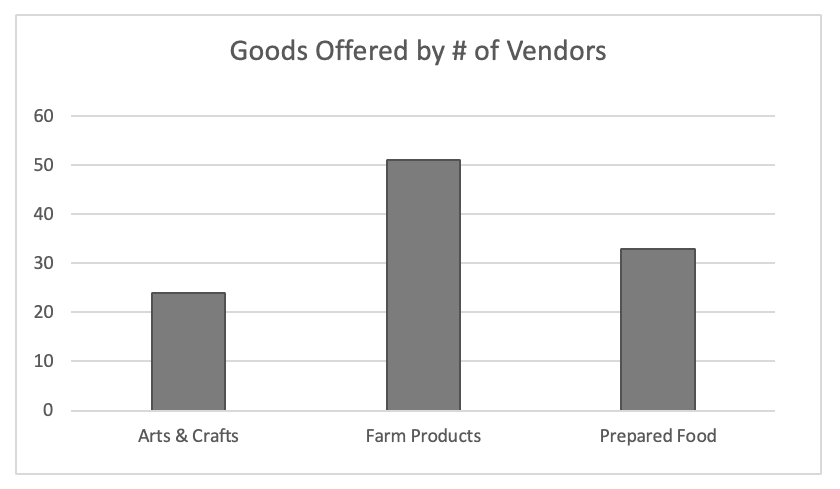
This chart illustrates the relative breakdown of vendors by the type of products sold. Vendors offering more than one type of product (such as farm goods plus value-added products) are included in both categories, so totals will add up to more than the 104 total vendors. The ratio of farm products to other offerings has remained relatively steady over time. In this study, farm products include fresh foods planted, grown and harvested with no or minimal processing.
Value-added products are those that are made from raw ingredients that they produce and process through baking, cooking, canning, or other preserving or processing. Prepared food includes products made from goods primarily purchased and intended for immediate consumption. The other category includes artisan crafts or other handmade or resold goods (those produced by a third party), typically non-food related (Beloit requires that goods be at least 50% produced by the vendor).
In addition to vendors, there are numerous nonprofit entities, performing artists and other entertainment at the market on a regular basis. This includes 127 local nonprofit entities and 15 local and regional performing artists. These participants are not included in the analysis portions of this report.
Visitor profile
Visitor counts and surveys were conducted three times during the season. These counts occurred twice in July and once in August, while surveys were conducted once in June and twice in July, to correspond with counts. Surveys were conducted by interviewing every 58th visitor entering the market, with a goal of achieving a pre-determined and standardized minimum threshold of surveys based on market size.
 Visitor location of origin
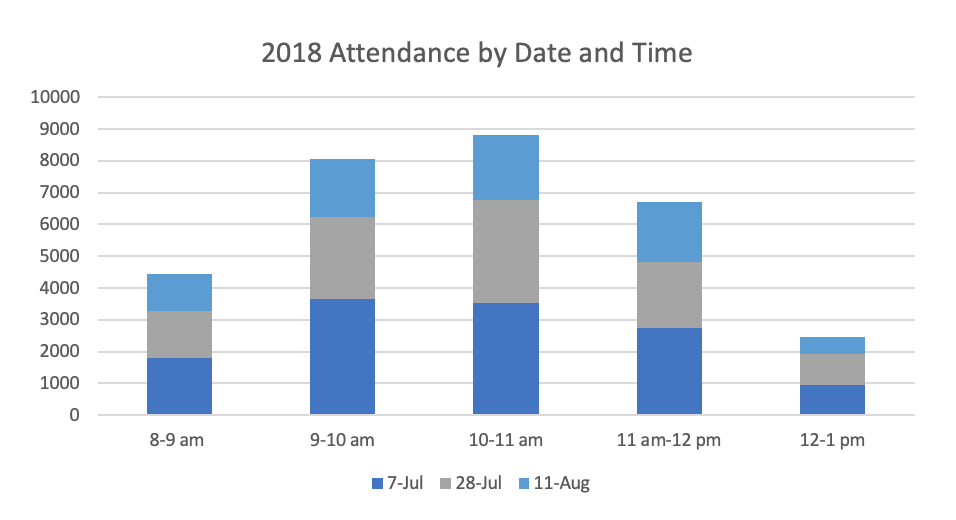
Over the season, accurate attendance counts from 2019 were not available, but prior-year averages indicate that the Saturday market attracted approximately 190,000 visitors to downtown. In 2018, attendance fluctuated based on the weather and time of year, with the average Saturday market in Beloit during peak season attracting more than 10,000 visitors. Visitor counts were highest between 10 and 11 a.m., with 9 to 10 a.m. a close second. While the 2017 market had many visitors staying through the noon hour, 2018 attendance declined sharply after noon, with the counts dropping by 75% for the final hour of the market.
Also in 2018, a separate count was taken to differentiate between adult and child visitors. Children represented an average of 17% of total market attendees, with more children arriving with each market hour, starting at 11% of visitors at 8 a.m. and peaking at 21% of all market visitors over the noon hour.
As with vendors, visitors to the market traveled from a large geographic area, as shown in the map above. In total, 50% of visitors were from Beloit, another 37% were from Rock or Winnebago Counties, and 13% traveled from Madison, Chicago, Minneapolis or other further-flung destinations, including those visiting the market as part of a larger trip to the Beloit area. The share of destination visitors was comparable to the prior year’s breakdown.
Twenty-one percent of visitors walked or biked to the market, which was much higher than the prior year’s 8%. There were a lot more walkers (17%) than bikers.
Although visitors were not asked specifically if the market was the main purpose of their visit, 53% indicated that they did not intend to engage in any other spending during the trip. Additionally, 5% of those surveyed passing through the market anticipated making no purchases at the market—about half of these were making purchases at adjacent businesses, and the remainder planned no spending during their outing.
Customer spending
Customers at the market spend dollars both at the market and at other downtown establishments as part of their trip. Both types of spending are important factors when evaluating the success of the market from a downtown development perspective.
Market spending
Over the course of the season, the market generated an estimated $919,194 in total sales. As is typical for markets, sales were highest during weeks with more visitors, although visitors during poor-weather weeks are often more dedicated to the market, resulting in higher per-visitor spending during these weeks. In contrast, high attendance weeks are likely to include a greater share of attendees who purchased limited or no goods—whether because they were there for ambiance, or because high traffic made purchases more difficult—resulting in lower total sales than would otherwise be expected. Individual visitors spent an average of $29.79 on goods and services at the market. Excluding the 5% of visitors who spent nothing, the per-visitor spending was $31.50.
Not all vendors in Beloit accept federal Supplemental Nutrition Associate Program (SNAP) benefits, although the percentage of those eligible and accepting has increased. Similarly, not all vendors accept credit or other alternate payment types, making a detailed comparison of spending across payment types difficult. Vendor participation in the income survey was lower in 2018 and 2019 than in prior years, with only one-quarter of vendors participating early in the season, dropping to less than 15% later in the season. As a result, certain types of sales may be overrepresented in the data. Based on results, it is likely that arts-and-crafts vendors more reliably returned surveys over the course of the market, resulting in significantly higher reported sales in this category than in prior years.
Overall, cash transactions made up 52% of all reported sales at the market, with 42% of sales made by credit card (the third year of increase in credit purchases) and the remaining 6% of sales through the SNAP, EBT or WIC benefit systems. These customers using alternate payment systems purchase roughly equivalent amounts of goods services to all visitors, with the average SNAP customer spending $20.71 at the market (in qualified goods)—a small decrease over the previous year. The average SNAP customer visited the market 1.7 times over the season, and 7% visited three or more times, with consistent frequency and total spending to prior years.
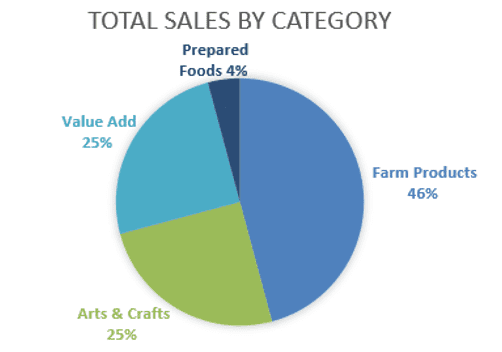
During the entire season, the most consumer dollars were spent on farm produce, followed by arts-and-crafts products.
Significantly more meat, seafood and dairy sales were reported in 2019 than in prior years. Although only a small percentage of vendor sales slips were returned in 2019, some information can be learned from sales records. For instance, the average vendor sold $469 in goods and services on any given market day, a similar amount to the prior year, although the mix of vendor sales reports likely influenced these results.
The range of sales volumes are also comparable, with some vendors reporting sales as low as $28 per day, while others earned $4,200 or more during a single market. Seasonality of sales was difficult to measure due to declining vendor survey participation over the course of the summer.
In a separate survey of vendors conducted by the Downtown Beloit Association, 51% of vendors indicated that 2019 earnings represented an increase over the 2018 season. The median reported increase was 6-10%. Four vendors did report a decrease in sales, and eight were new to the market in 2019. Vendors participating in the SNAP program also felt that it was beneficial to business (44% agreed). Vendors again reported positive feedback on the market, with 92% indicating that the market is well run.
Downtown spending
In addition to dollars spent at the market, many visitors also visited merchants elsewhere in downtown, whether for dining, shopping or services.
A total of 47% of visitors surveyed reported spending or planning to spend additional dollars downtown as part of their visit to the farmers market. Spending at the market was slightly higher for those groups traveling 60 miles or more to the market, and those visiting from out of town, with an average of $38.86 per visitor spent at the market versus $29.05 per visitor for those living in the immediate trade area. Additionally, visitors traveling 30-60 miles to Beloit spent almost one-third more at adjacent businesses than those who live locally.
Including individuals who did not make purchases beyond the market, the average downtown spending per market visitor was $12.82, increasing by more than $1 for the third year in a row. In total, over the course of the season, this ancillary spending by market visitors generates an estimated $1.9 million in sales for downtown businesses.
Economic impact
In addition to benefiting the vendors and adjacent businesses on event days, the Beloit Farmers Market has a further-reaching impact on the downtown and region. Sales earned on the day of the market correspond to additional employment and wages for farmers, craft persons and downtown businesses, and also result in state and local tax collections. Combined, the estimated annual economic impact resulting from the Beloit Farmers’ Market is:
- $2.9 million in additional economic impact and 12 jobs supported in downtown
- $3.7 million in additional economic impact and 52 jobs supported within the Janesville-Beloit MSA
Historic comparison
While there are numerous variables that influence various metrics in individual years—including weather, vendor mix and survey response—a comparison of key market data over time is provided in the table below:
| 2015 | 2016 | 2017 | 2018 | 2019 | |
| Attendees | 143,000 | 104,000 | 194,000 | 190,000 | 190,000 |
| % non-local (area/visitor) | 47% / 11% | 18% / 4% | 51% / 10% | 44% / 8% | 37% / 13% |
| Total Market Sales | $500,000 | $550,000 | $580,000 | $907,000 | $919,194 |
| Average Vendors in Attendance | unknown | 77 | 69 | 73 | 74 |
| Average external business spending per visitor | $17.03 | $6.71 | $8.69 | $11.27 | $12.82 |
