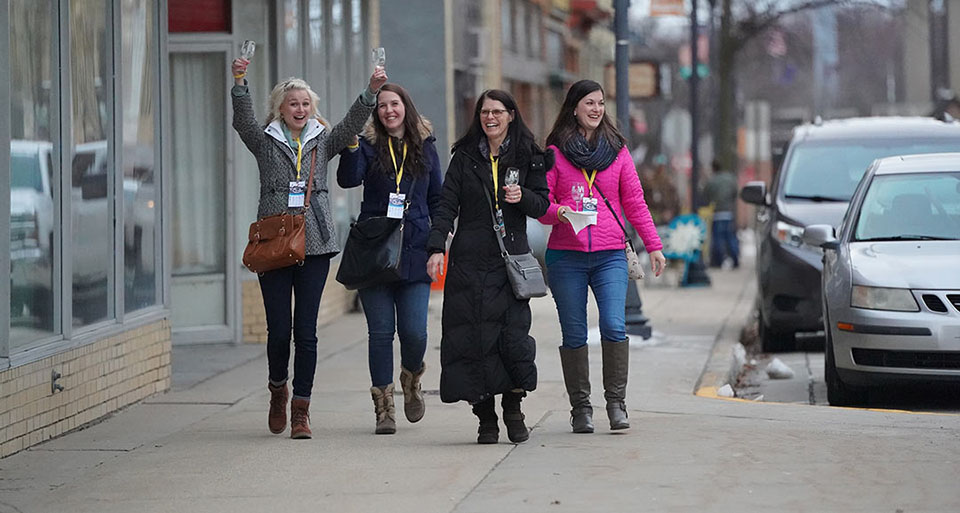
Another successful downtown event in Ripon, WI.
One of the best ways to plan for successful and fun promotional events downtown is to do your homework on what works in other communities around Wisconsin.
We’re here to help. We’ve assembled survey data from communities involved with the Wisconsin Main Street and Connect Communities programs, which host annual wine walks, music-in-the-park concerts and trick-or-treating events.
The results provide helpful insights on how you can plan and stage successful events that attract shoppers, resonate with businesses and provide fun events for people in your area. They also help you to set achievable goals when planning for your events.
To help account for differences between communities based on size, some survey responses are qualified for smaller communities (those under 5,000 in population) versus larger communities (those over 5,000).
Uncorking success in wine walks
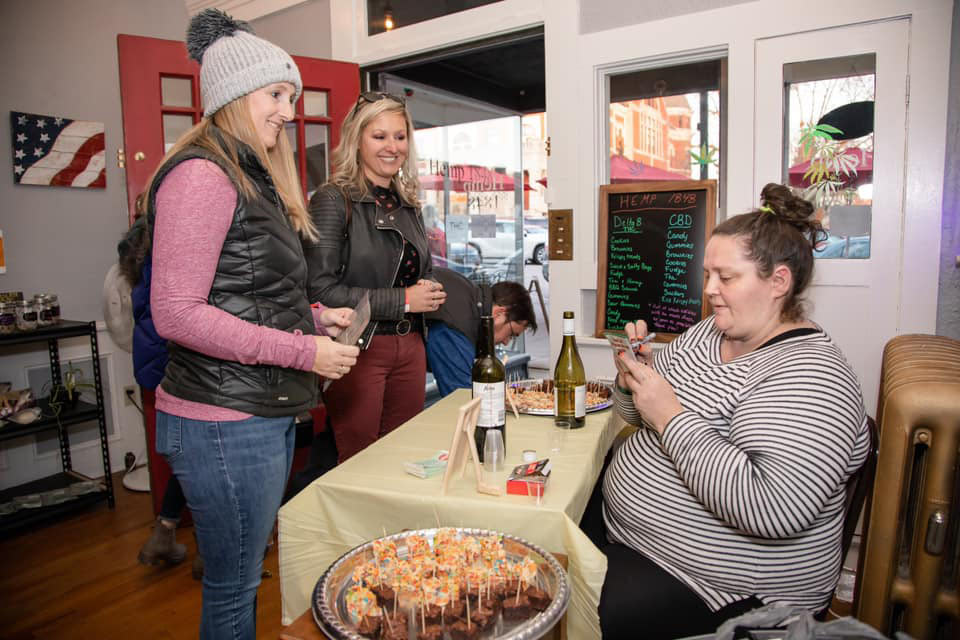
Participants enjoy another stop during the wine walk in Monroe, WI.
Since the passage of legislation enabling wine and beer walks was enacted in 2018, communities have experimented with strategies to maximize event participation and impact.
Event logistics
The law allows for two wine walks per year, and more than half of communities take full advantage of this opportunity.
By contrast, 46% host one wine walk each year, sometimes pairing it with a secondary beer or seltzer walk. Fall is the most popular time of year to host a wine walk, followed by spring, with summer and winter being least popular.
Compared to previous years, 38% of communities said their attendance in 2021 increased, 38% said attendance was about the same, 8% said attendance was worse, and the remaining 15% did not comment, either because this was a new event or because events were canceled due to the pandemic.
According to the Wisconsin Department of Revenue, a qualified organization may receive a temporary license for up to two wine walks during a 12-month period, and there is no limit on the number or temporary licenses that may be issued for a beer walk during a 12-month period.
Business participation
The average number of businesses participating in the wine walks per community is 20 businesses, the maximum allowed by state law. But businesses beyond the 20 allowed by statute must be licensed bars or restaurants.
Sixty-nine percent of communities had between 12 and 20 businesses participate, while 15% have 21 to 25 and the remaining 15% had more than 26 participating businesses.
Most communities—69%—charged businesses a fee to participate. The average price communities charge businesses to take part, including communities that do not charge a fee, was $54. The average among communities that charge a fee is $78.
Communities were also asked if participating businesses saw a change in sales during each event, and 60% of communities reported businesses on average saw an increase, while 20% said their businesses on average saw a decrease, and another 20% said sales were unchanged. It should be noted that communities reporting that businesses saw a sales decrease specified it was due to the pandemic.
Ticket sales and additional data
Survey results showed the average ticket price was $28, and communities varied on cost per ticket, with a range of $15 to $50.
Communities sold an average of 227 tickets per event. Thirty-eight percent of communities sold 201 to 300 tickets, 23% sold 50 to 100 tickets, another 23% sold 101 to 200 tickets, 8% sold 301 to 400 tickets, and the remaining 8% sold more than 401 tickets. In addition, 60% of communities said they typically sell out the available tickets for their wine walks.
Not all communities collected data on where wine-walk attendees live. But half of the communities that kept this data reported that a majority were locals, while 38% of communities attracted mostly non-locals, and the remaining 13% of communities had a 50-50 mix of locals and non-locals attending.
Budget and expenses
The average budget per community for hosting a wine walk event was $5,575 and the total budget per community ranged from $750 to $15,000.
Data shows that the average net revenue per community was $3,800, with individual communities reporting total net revenues ranging from $500 to $8,500.
Additional insights and innovative ideas
Surveyed communities ranged in population size from 1,400 to 105,000. With such a wide range in community size, some insights were established. Three-quarters of smaller communities host one wine walk a year, and smaller communities average 20 businesses that participate in each event and sell an average of 180 tickets. By contrast, two-thirds of larger communities host two wine walks a year, and they also average 20 businesses that participate in each event and sell an average of 248 tickets.
Communities were also asked if there was anything unique or innovative that makes their events successful. Responses included: providing a nice selection or higher quality of wines; creating outdoor event spaces as part of the walk and hosting an event after the wine walk with raffles and music—allowing people without tickets to still attend and enjoy a fun event. Other tips included: establishing a selfie spot at registration, focusing on food pairings, having disposable cups and giving a swag bag with commemorative wine glass, having a local winery sponsor and focusing on Wisconsin wines, partnering with a charity and sharing with it a percentage of the event proceeds, offering private tastings prior to the event for host businesses, hosting the two annual events on different days and times to attract different crowds, and offering beer options.
Hitting the right notes on park concerts
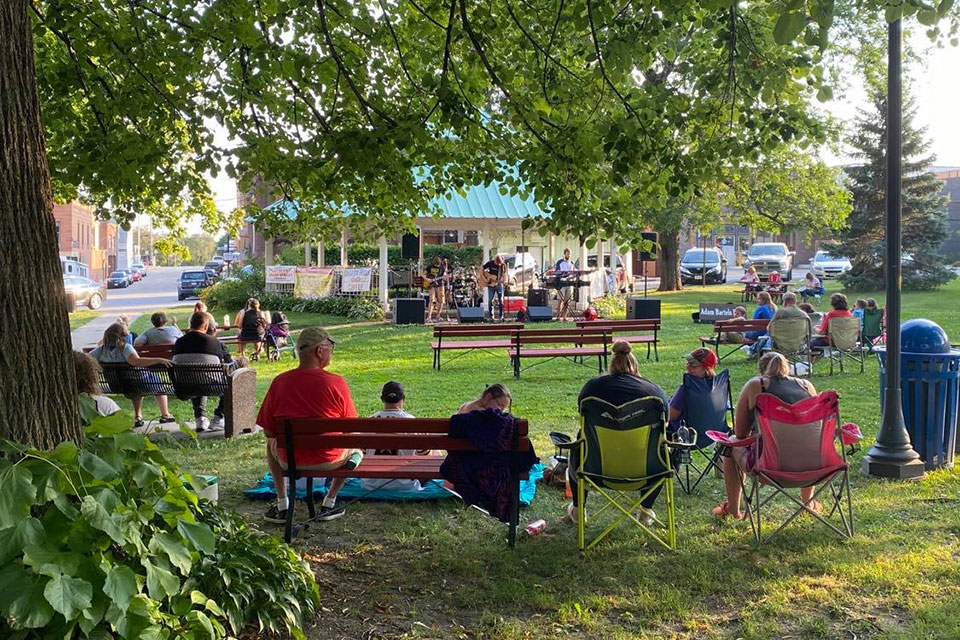
Community members from Platteville, WI enjoying a concert in the park.
Music-in-the-park events are another popular way of attracting visitors to downtown during evening and weekend hours all summer. By offering a recurring event with diverse acts, locals and visitors can plan to attend music events that appeal to them.
Event logistics
More than half of the communities responding to the survey hosted 10 or more events each summer, compared to 46% that hosted less than 10 per summer. In general, smaller communities are averaging seven events and larger communities average 12 events.
Wednesdays are the most popular day of the week to host music-in-the-park events, with one-third of respondents scheduling events on that day, with Thursdays and Saturdays being close second at 22% each, and Fridays and Sundays being the least popular at 11% each. Weekdays are a popular choice, because the events are less likely to compete with larger community events. That also helps boost traffic downtown on what would otherwise be a slower night for businesses.
Two-thirds of communities hosted local bands at their music-in-the-park events, followed by regional bands at 44%, national bands at 11% and traveling bands at another 11%. The average band fee is $892, with smaller communities averaging $400 per band and larger communities averaging $1,285 per band. The average band fee per community ranged from $150 to $3,750.
While 44% of the communities did not allow carry-in alcohol, another 44% did allow it, and 22% sold beer and wine during the event. Some of the communities that did not allow carry-in alcohol at the events noted that there are nearby bars to visit. Some communities that allowed carry-in alcohol noted that attendees were required to purchase from local establishments to-go for the events if they wanted to carry-in.
Business and vendor participation
Two-thirds of communities said they had vendors and/or businesses participate in the event series, and of the communities that had vendor/business participation, the number of vendors/businesses averaged seven, with no difference between smaller and larger communities.
Of the participants, 56% sold food, 33% were crafters, 22% were artists, and classes and alcoholic beverages each came in at 11%. Most communities have more than one vendor type, so the total does not add up to 100%.
In addition, 44% of communities charge their vendors and businesses to participate, with one community charging food and beverage vendors 15% of their net profits. Fee structures include both per-event and seasonal rates.
Many communities look to boost business sales during the event and survey downtown businesses to understand consumer patterns before and after the event. For those communities conducting surveys, 43% found that a few of the downtown businesses were open during the concerts, 29% said most businesses were open during the concerts and the remaining 29% said no businesses or hardly any businesses were open during the concerts.
Concert attendance
An average of 680 people attended each concert, with smaller communities averaging 197 people per concert and larger communities averaging 970 per concert.
Budget and expenses
The annual concert budget per community averaged $7,134. The average budget per smaller community was $1,413, and the average budget per larger community was $11,712. The total budget per community ranged from $850 to $34,000.
The net revenue per community for the concert season averaged $3,128. The average net revenue per smaller community was $467 and the average budget per larger community was $4,720. The total net revenue per community ranged from $400 to $17,000.
Additional information and feedback
Communities that participated in the survey ranged in size from 947 in population to 38,735 in population. With such a wide population range, some insights were established. Communities under 5,000 did not have a consistent day of the week but favored end of the week/weekend, and half of the smaller communities hosted vendors at the concerts. By comparison, 60% of larger communities hosted events on Wednesdays and 80% hosted vendors.
Communities offered some tips and innovative approaches for the events, including providing a beautiful setting with local food and beverages; emphasizing fun things for kids to do, such as nighttime kickball or bounce houses; hosting concerts more often throughout the warm season; and keeping a banner in place announcing upcoming concert dates and bands for visitors to see throughout the summer. They also suggested adding popular bands to the line-up to increase attendance and beverage revenue; partnering with civic organizations to market and program concert dates, such as a police department for a Community Safety Day; including a 50/50 raffle; putting out yard games; providing an indoor rain location for consistent weekly concerts; and booking bands directly instead of using a booking agency.
Downtown Halloween hijinks
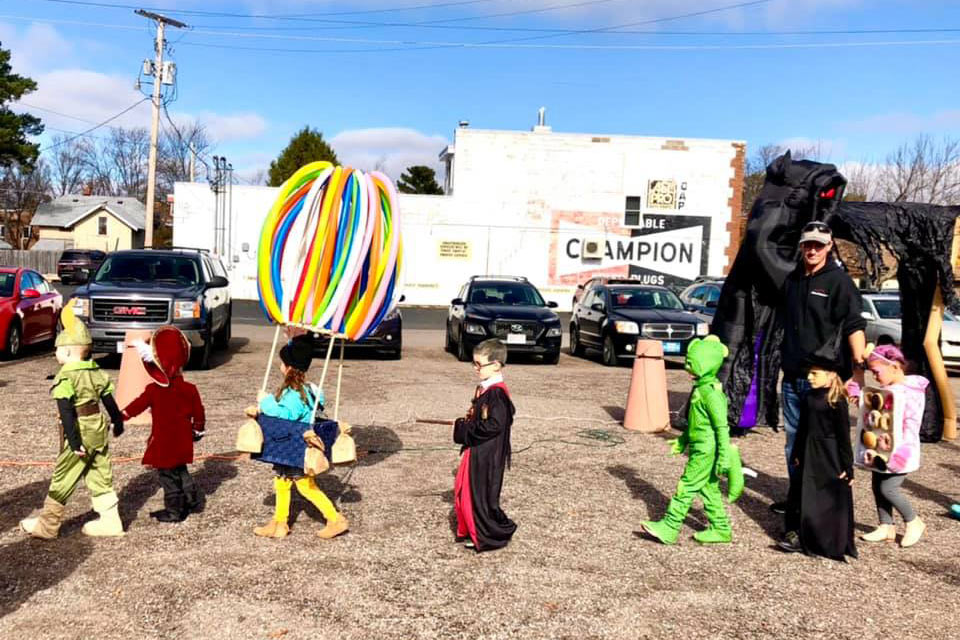
Children and parents alike enjoy the trick-or-treating event in Eagle River, WI.
Trick-or-treating events are another popular way to bring local families downtown to visit new businesses and help local youth make positive connections with downtown.
Event logistics
Fifty-four percent of communities hosted trick-or-treating events on the Saturday before Halloween, while 23% of communities hosted their event on Halloween, 15% hosted their event the Friday before Halloween and the remaining 8% staged their event on the Thursday before Halloween. Of those surveyed, 46% reported that their events were scheduled in the evenings, followed by afternoons at 38% and mornings at 15%.
Business and vendor participation
The average number of businesses participating in the trick-or-treating event per community was 32, with smaller communities averaging 20 businesses and larger communities averaging 40 businesses.
Fifty-four percent of the communities had between 21 and 40 businesses participate. Some large communities had as few as 20 businesses or groups participate, and some small communities had as many as 30 businesses or groups take part.
Communities were also asked if participating businesses saw a change in sales during or following a trick-or-treating event, and 79% of communities said businesses saw no change. Meanwhile, 21% said they saw an increase during the event, 7% said they saw a decrease during the event and the remaining 7% said they saw an increase following the event.
Forty percent of small communities reported businesses saw an increase in sales during or following the event, and 22% of large communities had businesses reported increases. Businesses experiencing an increase after the event often include bounce-back coupons or other specials for parents of trick-or-treaters to boost future sales.
Event attendance
Communities reported an average attendance of 1,082, with smaller communities averaging 500 people and larger communities averaging 1,483 people. Some large communities had as few as 500 attendees, and some small communities had as many as 1,200 attendees.
Budget and expenses
The average community budget was $870, with small communities having an average budget of $500 and large communities reporting an average budget of $963. The total budget per community ranged from $0 to $5,000. More than three-quarters—79%— of communities do not anticipate revenue from these events, although 7% reported net revenue averaging $250.
Additional information and feedback
Because of the wide variance in community size, with those responding to the survey ranging from 1,626 to 60,025 in population, certain trends emerged. Smaller communities didn’t have a dominant day on which they host their trick or treating event. Fully 40% said they host it on the Saturday before Halloween, 20% said they host it on the Thursday before, 20% said they host it on the Friday before and the remaining 20% said they host it on Halloween. Additionally, half of small communities host the event in the evening and the other half host the event in the afternoon. By comparison, 63% of larger communities host trick-or-treating on the Saturday before Halloween. Evenings were the most popular at 44%, with 33% holding events in the afternoon and 22% in the morning.
Respondents offered an array of suggestions for staging successful Halloween events. They included partnering with other organizations; organizing scavenger hunts for the kids to go into each business; hosting a costume contest; and encouraging downtown movie theaters to provide a free movie as part of the event. Other suggestions included working with the local fire and police departments for event traffic control; encouraging businesses to have a presence on the street; showing a kid-friendly Halloween movie in the park; hosting additional events in the downtown or downtown park that coincide or complement the event; and having costumed characters handing out candy. And other communities suggested hosting a haunted house or tour; including jump houses and giant inflatables; including a DJ and music during the event; shutting down the main street downtown; encouraging individual businesses to stage their own activities; hosting a themed wine walk for adults in the evening following the trick-or-treating event; and inviting outside businesses to participate, pop-up shop style, in closed businesses or vacant buildings.
